Advanced Graph and Chart Collection 4.94
Add Powerful reporting features to your Web / Intranet pages and applications.
Add Powerful reporting features to your Web / Intranet pages and applications. With the advanced graphing package you will be quickly adding impressive dynamic charting capabilities bringing your data alive !
Software Specs
Publisher:............ Sirius Computer Consultants Limited
License:............... Shareware
Price:................... $195
File size:.............. 390 KB
Downloads:.........
Release date:...... 19 Apr 2006
Last update:........ 26 Feb 2014
Language:............ English
Publisher review for Advanced Graph and Chart Collection 4.94:
Review by: Sirius Computer Consultants Limited
Add Powerful reporting features to your Web / Intranet pages and applications. With the advanced graphing package you will be quickly adding impressive dynamic charting capabilities bringing your data alive ! Powerful components provide both client & server side solutions for adding graphs & charts into web / intranet pages & applications. Enabling web authors & Java developers to easily build and publish dynamic interactive graphs & charts. Each chart contains many configurable features and functions. The documentation and examples are designed to give both a full understanding of every feature and enable you to implement both the applets and servlets quickly and easily. The applets and servlets can acquire data from a variety of sources including, Files Databases Scripts and server Side processes (eg. Servlets, JSP, ASP, PHP, PERL) HTML parameters Graph Chart Styles 2D Pie Chart 2D Line Graph 2D Vertical Bar Graph 2D Stacked Vertical Bar Graph 2D Horizontal Bar Graph 2D Stacked Horizontal Bar Graph 2D Area Graph 3D Pie Chart 3D Line Graph 3D Vertical Bar Graph 3D Stacked Vertical Bar Graph 3D Horizontal Bar Graph 3D Stacked Horizontal Bar Graph 3D Area Graph Main Features Summary Anti-Aliasing giving a far smoother pie image Multi Language Support Percentage option for labels Pre & Post symbols on pop-up values Change Cursor on Mouseover links Demos & Examples 2D/3D Graphing Mode Various Data Sources (Files, Databases, Scripts/Server processes, HTML parameters). JavaScript interaction. Printer Friendly Labels On/Off, Font and Color Selectable Target Lines Trend Lines Multiple Plots Configurable Point Symbols Automatic Legend Generation Configurable Number of decimal places to show values Label Orientation Configurable Depth of the 3D effect Display Values on Mouse Over events URL link on Mouse Click Events Free Form Images can be incorporated into the Chart Canvas Free Form Lines of Text can be incorporated into the Chart Canvas
Requirements:
Standard Web Browser
Operating system:
Win95,Win98,WinME,WinNT 3.x,WinNT 4.x,Windows2000,WinXP,Windows2003,Windows CE,OS/2,OS/2 Warp,OS/2 Warp 4,MAC 68k,Mac PPC,Unix,Linux
Limitations:
Registration Message
Release notes:
New Release
Whats new in version 4.94:
New in this Release . . Anti-Aliasing giving a far smoother pie image . Multi Language Support . Percentage option for labels . . Pre & Post symbols on pop-up values. Change Cursor on Mouseover links . . Graph Chart Styles. . 2D Pie Chart . 2D Line . Graph . 2D Vertical Bar Graph . 2D Stacked Vertical Bar Graph . 2D Horizontal Bar Graph . 2D Stacked Horizontal Bar Graph . . 2D Area Graph . 3D Pie Chart . 3D Line Graph . 3D Vertical Bar Graph . 3D Stacked Vertical Bar Graph . 3D Horizontal Bar . Graph . 3D Stacked Horizontal Bar Graph . 3D Area Graph . . . Main Features Summary. . 2D/3D Graphing Mode. Various . Data Sources (Files, Databases, Scripts/Server processes, HTML parameters). JavaScript interaction. . Printer Friendly . . Labels On/Off, Font and Color Selectable . Target Lines . Trend Lines . Multiple Plots . Configurable Point Symbols . . Automatic Legend Generation . Configurable Number of decimal places to show values . Label Orientation . Configurable . Depth of the 3D effect . Display Values on Mouse Over events . URL link on Mouse Click Events . Free Form Images can be . incorporated into the Chart Canvas . Free Form Lines of Text can be incorporated into the Chart Canvas . . . The new release contains the following updates:-. The Graphing Servlets have been upgraded to improve performance. As a result the graph images are produced much . quicker and use less of the server memory. In addition they no longer require the X11 Graphics Environment when running on Unix and Linux machines.

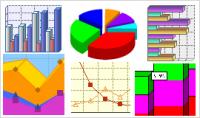
Advanced Graph and Chart Collection screenshots:
Advanced Graph and Chart Collection download tags:
graph chart graph and chart graphing charting line chart graph line graph pie chart bar
Copyright information:
SPONSORED LINKS
Based on 0 ratings. 0 user reviews.